| Year |
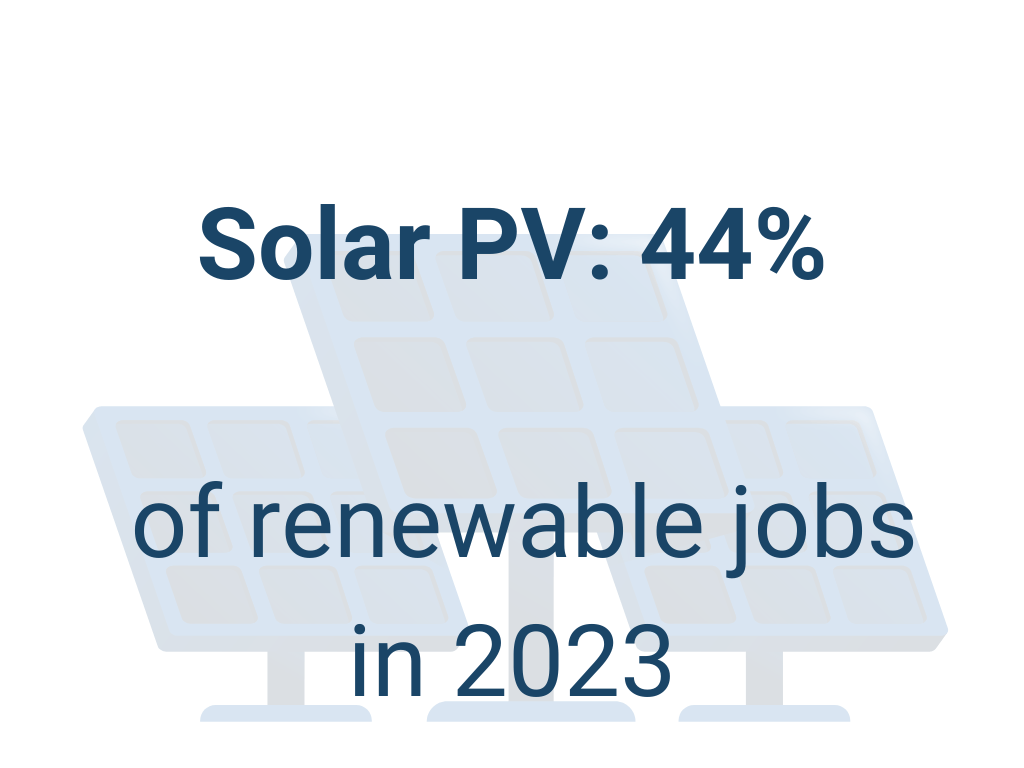
Solar PV |
Bioenergy |
Hydro |
Wind Energy |
Solar Heating/Cooling |
Others |
|
Million Jobs |
| 2012 |
1.36 |
2.40 |
1.66 |
0.75 |
0.89 |
0.22 |
| 2013 |
2.27 |
2.50 |
2.21 |
0.83 |
0.50 |
0.23 |
| 2014 |
2.49 |
2.99 |
2.04 |
1.03 |
0.76 |
0.19 |
| 2015 |
2.77 |
2.88 |
2.16 |
1.08 |
0.94 |
0.20 |
| 2016 |
3.09 |
2.74 |
2.06 |
1.16 |
0.83 |
0.24 |
| 2017 |
3.37 |
3.05 |
1.99 |
1.15 |
0.81 |
0.16 |
| 2018 |
3.68 |
3.18 |
2.05 |
1.16 |
0.80 |
0.18 |
| 2019 |
3.75 |
3.58 |
1.96 |
1.17 |
0.82 |
0.18 |
| 2020 |
3.98 |
3.52 |
2.18 |
1.25 |
0.82 |
0.25 |
| 2021 |
4.29 |
3.44 |
2.37 |
1.37 |
0.77 |
0.43 |
| 2022 |
4.90 |
3.58 |
2.49 |
1.40 |
0.71 |
0.64 |
| 2023 |
7.11 |
3.88 |
2.32 |
1.46 |
0.68 |
0.78 |
Notes: (a) Includes liquid biofuels, solid biomass and biogas.
(b) Direct jobs only.
(c) “Others” includes geothermal energy, concentrated solar power, heat pumps (ground based), municipal and industrial waste,
and ocean energy.
Source: IRENA and ILO (2024), Renewable energy and jobs: Annual review 2024, International Renewable Energy Agency, Abu Dhabi, and International Labour Organization, Geneva.
URL of Source: https://www.irena.org/-/media/Files/IRENA/Agency/Publication/2024/Oct/IRENA_Renewable_energy_and_jobs_2024.pdf
Cite Chart: RenewStats.com. (2025). Global, Renewable Energy Employment by Technology, 2012-2023. Retrieved from https://renewstats:com/region/global/2025/01/16/renewable-energy-employment/
show less