| Year |
Solar PV |
Solar Heating/Cooling |
|
Million Jobs |
| 2012 |
1.36 |
0.89 |
| 2013 |
2.27 |
0.50 |
| 2014 |
2.49 |
0.76 |
| 2015 |
2.77 |
0.94 |
| 2016 |
3.09 |
0.83 |
| 2017 |
3.37 |
0.81 |
| 2018 |
3.68 |
0.80 |
| 2019 |
3.75 |
0.82 |
| 2020 |
3.98 |
0.82 |
| 2021 |
4.29 |
0.77 |
| 2022 |
4.90 |
0.71 |
| 2023 |
7.11 |
0.68 |
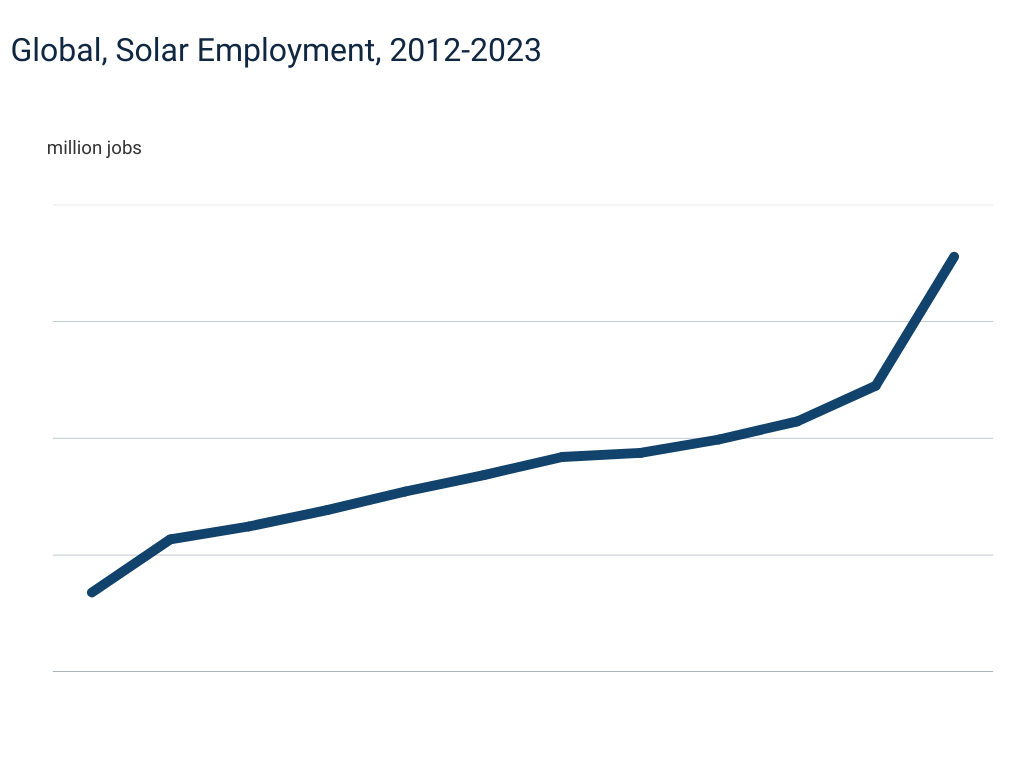
Notes: IRENA estimates global solar PV employment at 7.1 million in 2023, a significant increase from 4.9 million in 2022. Asia, led by China, accounts for 77% of the world’s PV jobs. Europe contributes 10.7% (with the EU at 10.1%), the Americas 8.6%, and the remaining 3.3% is spread across other regions.
Source: RENA and ILO (2024), Renewable energy and jobs: Annual review 2024, International Renewable Energy Agency, Abu Dhabi, and International Labour Organization, Geneva.
URL of Source: https://www.irena.org/-/media/Files/IRENA/Agency/Publication/2024/Oct/IRENA_Renewable_energy_and_jobs_2024.pdf
Cite Chart: RenewStats.com. (2025). Global, Solar Employment, 2012-2023. Retrieved from https://renewstats:com/chart-type/trend/2023/08/07/global-solar-employment/
show less